
Introduction
Moving to Explore is not starting again for Insights users. You are already familiar with the Support product and the relationship between objects. The metrics and attributes within Insights are largely the same. There are some terminology changes and things do look different but they are not big impediments.
While you may have to recreate many of your reports, the starting point should be to look at what has been provided for you by Zendesk. Then examine these reports that most interest you. Recreate them first. Because there are many ways of doing the same thing, following Zendesk’s example is more likely to be best practice. There are also some configuration settings that are not always immediately visible. Finding your way to these settings and examining how they work is a good learning tool.
Things you already know
If you are familiar with Insights, you have a head start with Explore. Much of your knowledge will still apply:
- You are still reporting on the same Support product
- The data structure in Support remains the same
- The reporting structure in Explore remains largely the same
- If you already understand the relation between metrics and attributes that is still valid in Explore
What has changed
Terminology
There are other terminology changes but these are the first that you will encounter.
- Report ➜ Query
- What panel ➜ Metrics panel
- How panel ➜ Column, Row, Explosion panel
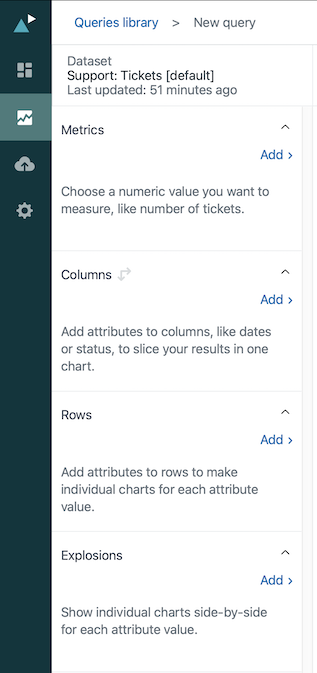
You will find the former HOW panel is now split into Columns, Rows and Explosions. Insights, used buttons to distinguish these ares but Explore splits these into clear separate panes.
Datasets
Insights reporting pane greyed out items as you selected metrics:
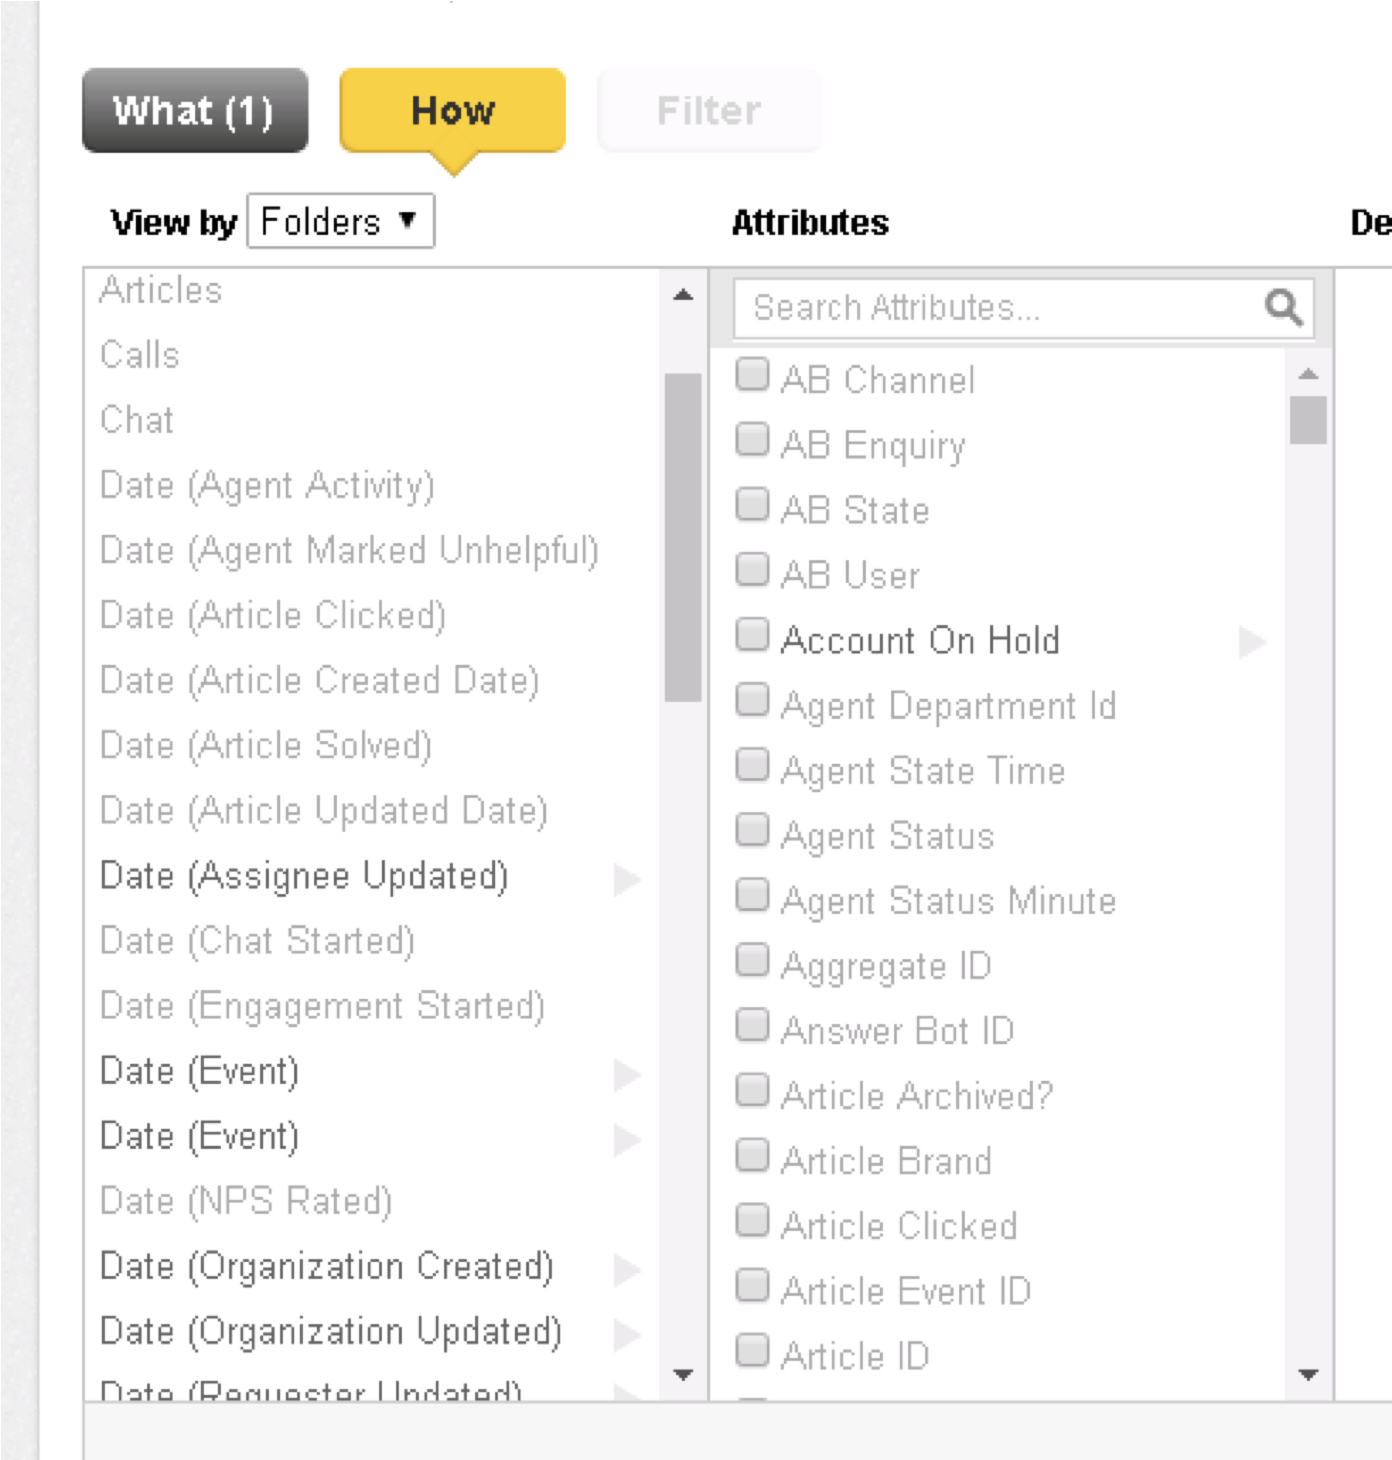
Here a metric has already been added to the WHAT panel and that has automatically restricted the HOW options available by greying out some items. This stops you combining objects that do not relate to each other.
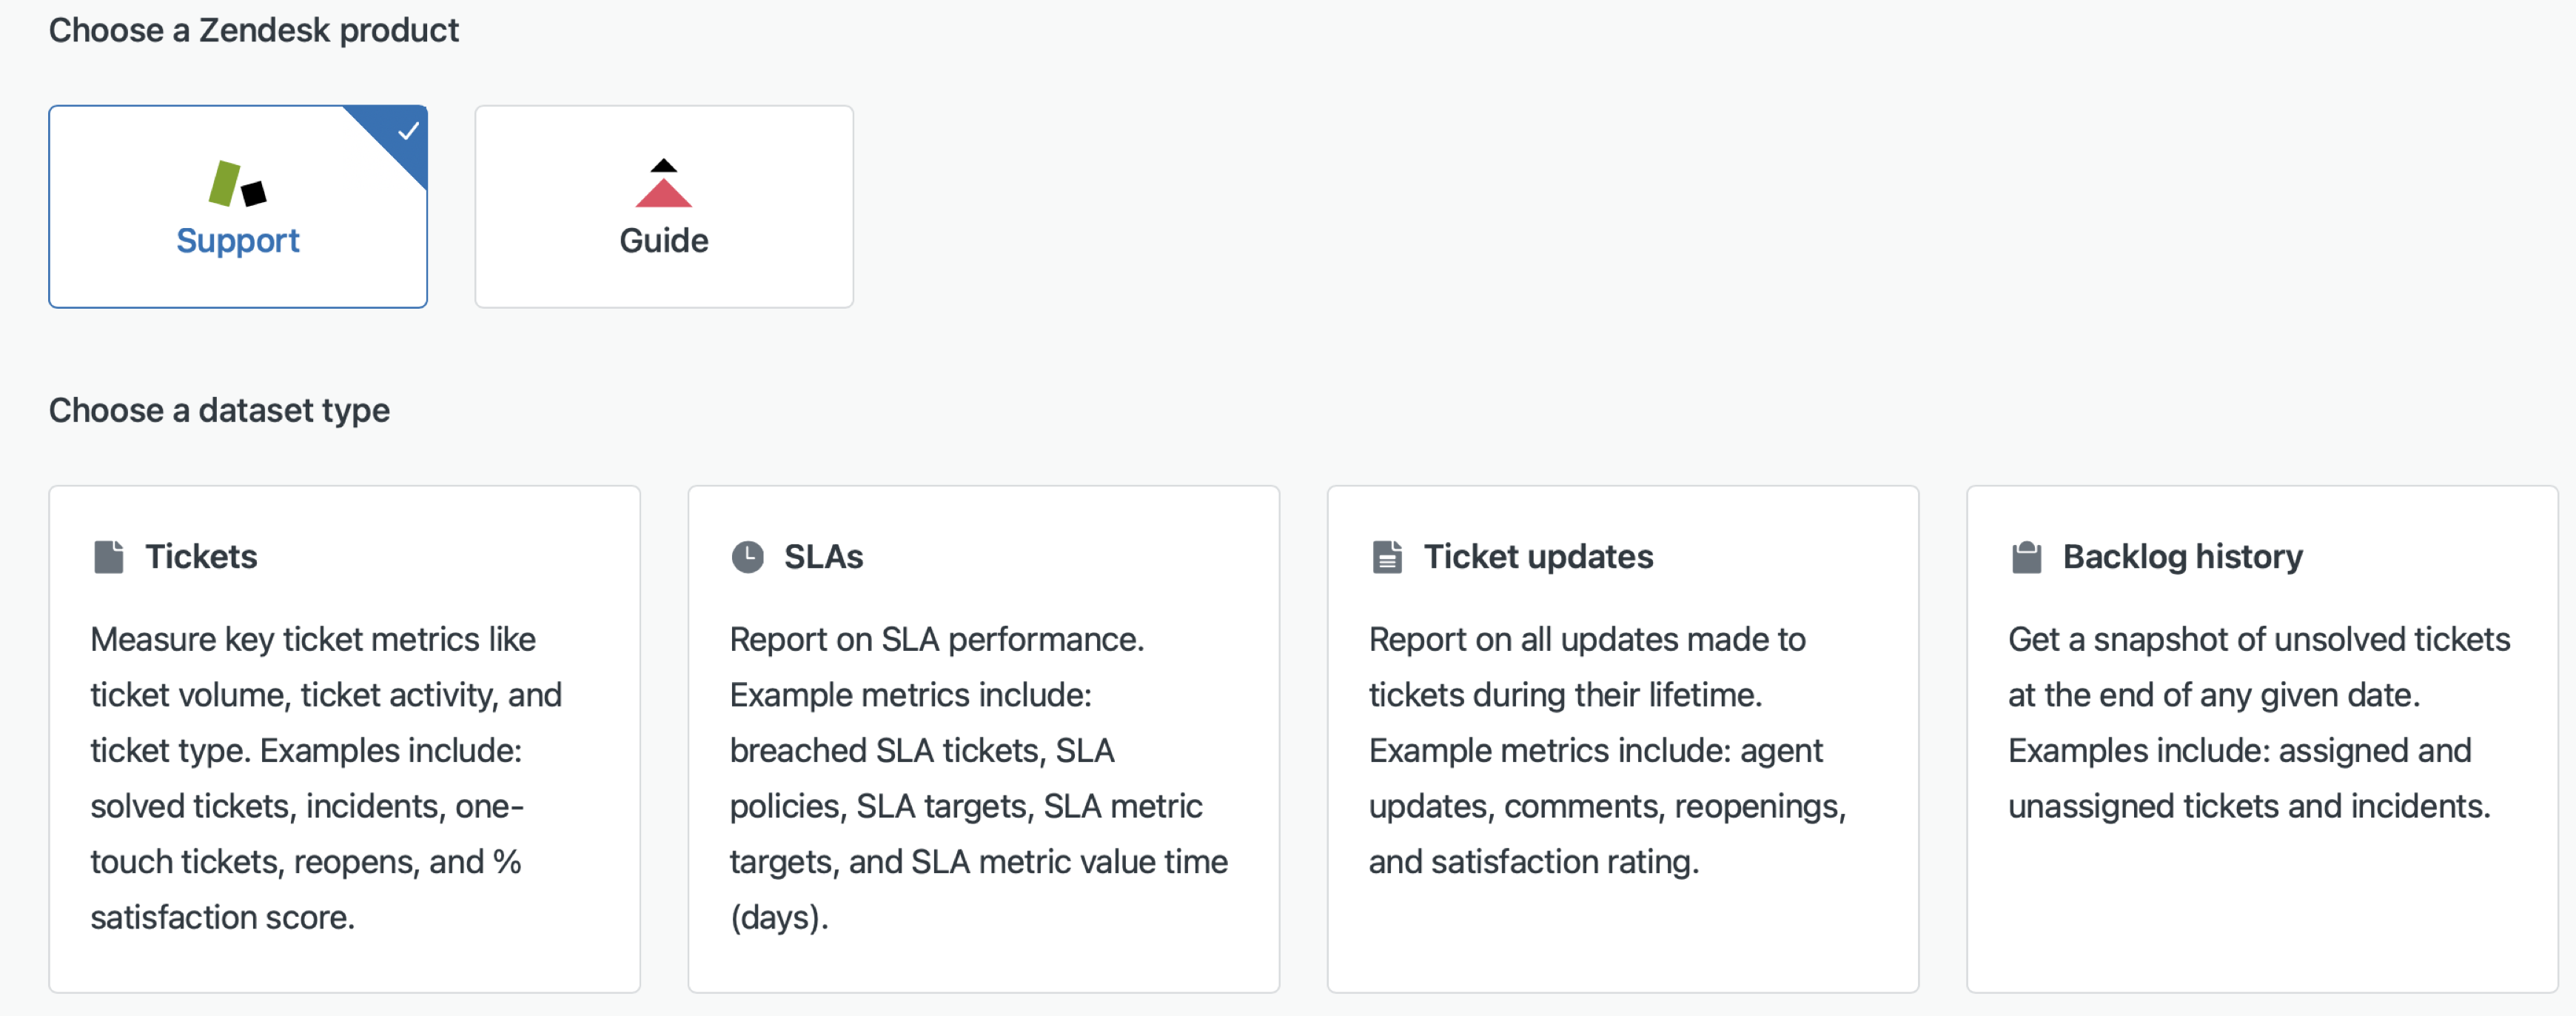
In Explore, you choose your dataset before building your query. So only compatible objects will be available once you pick your dataset.
Steps for moving to Explore
Before you start
Rather than attempting to recreate all your legacy reports and metrics, use the migration as an opportunity to rationalise your reporting. Some objects will no longer be needed and some will need improvement because your business has changed.
Some of your legacy reports will have been created with many years experience and include complex custom metrics. These item may have gone through several cycles of refinement. While the temptation to translate these in Explore may be high, the challenge of learning a new product, a new way of writing formulas should not be underestimated.
Consequently, starting with your legacy reports may not be the best approach.
First steps
Zendesk provide many pre built dashboards and queries. This is the best place to start your migration.
- Familiarise with these first
- Look at the style and features of the dashboards and reports
- Consider if these are sufficient to meet your reporting needs
- Discuss them internally with users
Second steps
Use the Zendesk provided items as a starting point to refine your reporting needs and learn how the queries are constructed.
- Find an interesting query on a Zendesk provided dashboard
- Clone the dashboard
- Investigate how the query was put together
- Manually recreate the query from scratch
Recreating the provided queries is a key tool in learning Explore. By recreating the query you are more likely to remember how it works. There are also different ways of achieving the same result. By following the Zendesk provided method, you are more likely follow best practice.
But Explore has many options for configuring chart types and metrics. Some of them are not obvious.
They can appear in the Chart Configuration and Result Manipulation menus.

Chart Configuration allows you to change colours, display formats and legends along with other options.
Result Manipulation includes sorting, totalling, filtering metrics and creating additional calculations.
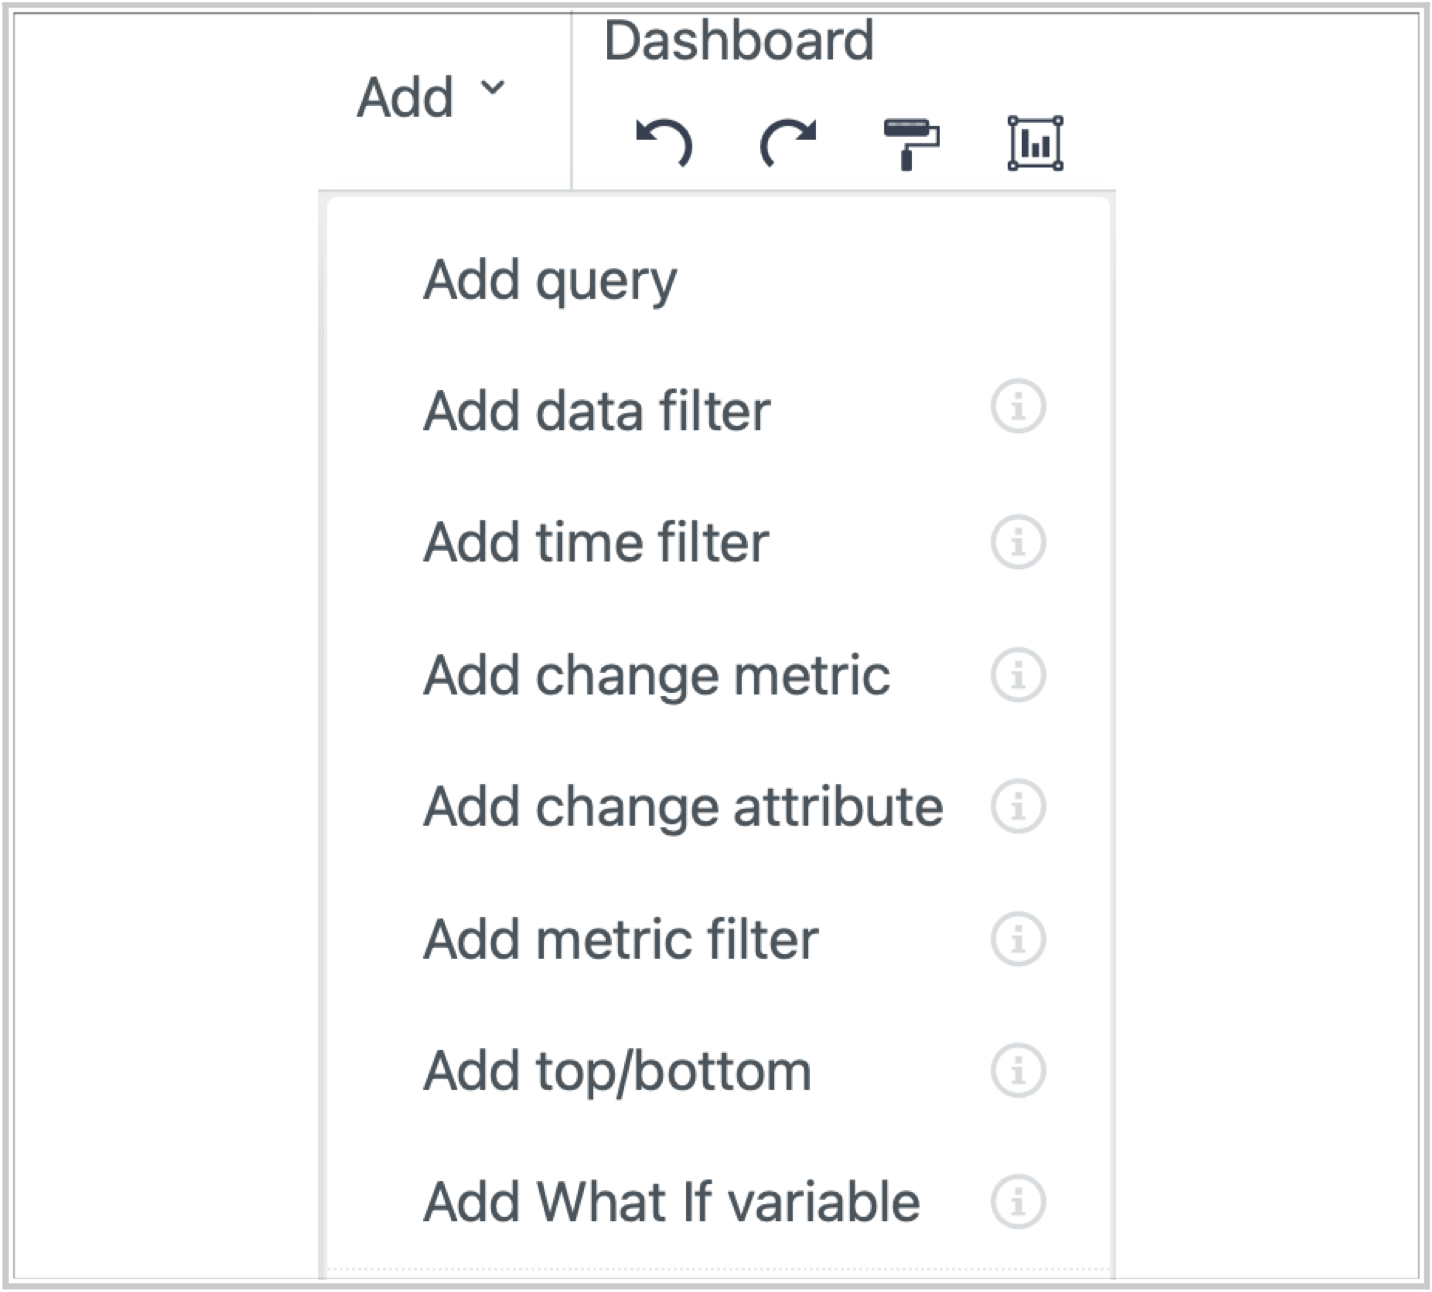
Once you have your query, try placing it on a dashboard.
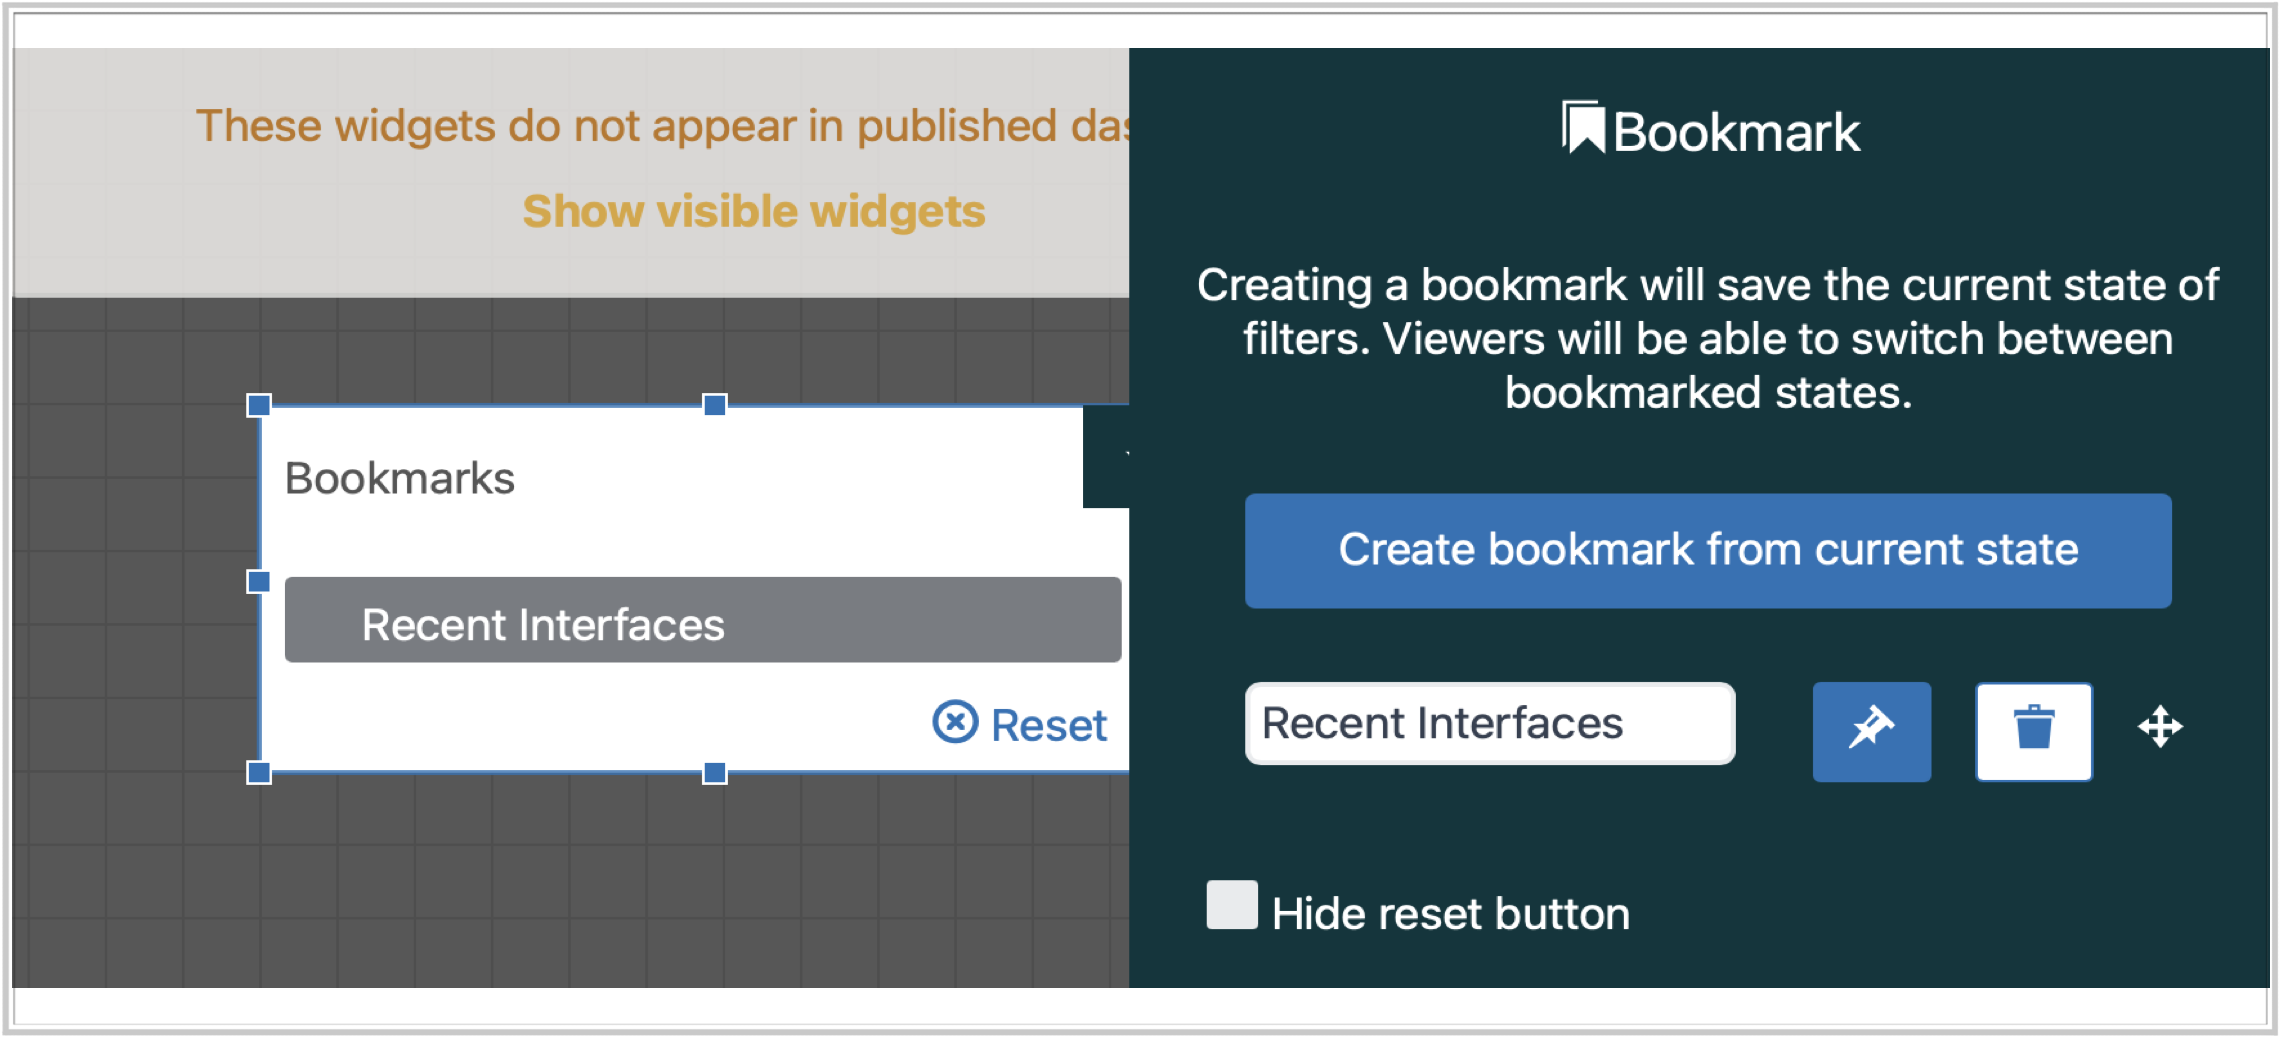
Dashboards have similar features to Insights. For example, filtering is similar to Insights:
Bookmarks preserve filter settings, but may be hidden!
The best way to learn is to explore the provided examples and see how they work.
Third steps
Once you have reviewed the Zendesk provided queries and dashboards, review your existing reports against the them.
Consider if your existing reports are still required. If there are similar provided reports it may not be worth migrating your legacy version.
There are also many Explore recipes that may come close to your needs. Check these first before starting fresh. You have to recreate each recipe. Once you have done that, you may be able to refine it to match your needs.
Fourth steps
If you have reviewed your existing reports, checked out the provided Zendesk queries, recreated some queries and dashboards, explored the chart configuration and result manipulation options, reviewed the Explore recipes, you are now ready to tackle your legacy reports.
What is better
Here is one example of how thing have evolved in Explore and why a methodical approach is required: tag reporting. Tags are commonly used in business rules and custom fields.
An Insight metric may look like this:

In Explore, you would say:
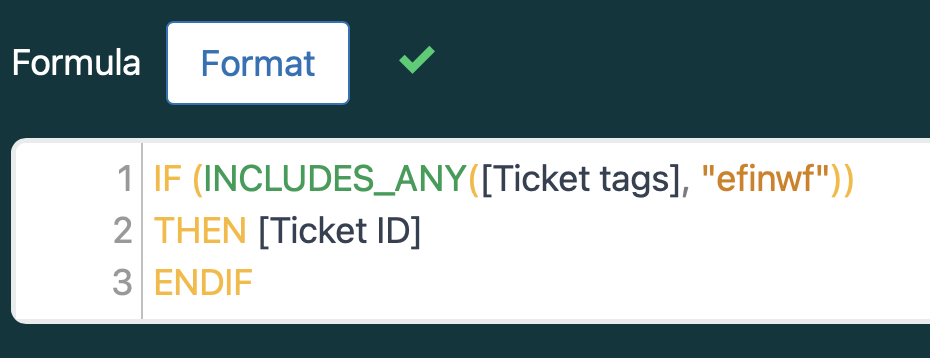
Like all custom metrics, the function looks very different. So you cannot use the old syntax in the new platform. But you will quickly learn the new approach by following the Zendesk provided examples.
You will also find that you can now report on multiple tags within a ticket, and also use more complex criteria such as AND / OR conditions that were not possible before.
Conclusion
Moving to a new reporting package can be daunting. But if you have knowledge of the Support product and some reporting experience, you already have a head start. To familiarise with Explore, start with an area that interests you from the Zendesk provided dashboards and queries. Recreate the queries checking the configuration and manipulation settings used.
If you need more than provided by Zendesk, check out the Recipes and create more queries that interest you.
Hopefully, by learning from the examples already available, your path to Explore will be smooth.
Comments
0 comments
Please sign in to leave a comment.